 Go to Swayam
- Home
- About
- Consulting
- Services
- Minfy Labs
- Industries
- Resonances
- Careers
- Contact
Main cost for any distribution utility is the cost of power (80% of the total cost*), since power needs to be managed in real time, means utility need to consume all that they have purchased. In case of deviation which is either in form of a surplus or deficit, the utility has an option of buying or selling in the market- either day ahead or during the day in the real time market
Also, the grid stability requires that states schedule only the quantum they can consume else there is risk of grid failure and to ensure grid stability the regional grid imposes a deviation settlement penalty on the concerned state.
In case of failure to accurately predict the demand for next day or for next few hours there is a significant commercial impact on the states, which is estimated to be in the range of 0.5-2% *of their power purchase cost. Power purchase cost varies from state to state but can be estimated to be in the range of INR 100 billion to INR 300 billion* for major states in the country. The uncertainty is going to be higher as the share of renewable energy in the energy mix increase, due to the intermittent nature of its supply. The generation of the RE energy also needs to be forecasted to accurately predict the supply.
Time series forecasting means to predict the future value of an item over a period. With Minfy’s AI capabilities, a machine learning solution was proposed, by leveraging the power of AWS’s AI services like Amazon SageMaker and Amazon Forecast.
Minfy demonstrated with a proof of concept, that using historical electricity demand data, we can build, train and deploy a machine learning model to produce forecast with accurate results.
The historical demand data is first uploaded to a S3 bucket. Using a Jupyter notebook instance of Amazon SageMaker, the timeseries data which includes four different timeseries, is then prepared for training different machine learning models.

Figure 1 Historical Demand Data
The data pre-processing includes the following steps
1. Managing outliers – Outliers are the data points that significantly differs from the patterns and trends of the other values in the timeseries. It can happen due to reasons such as equipment failure, power failure due to electrical faults, human error, etc. these outliers can hinder the learning process of our machine learning models so it is needed to change the values of these data points. Machine learning techniques such as forward filling, backward filling, polynomial interpolation, etc are used to change the value of these outliers
2. Data Analysis – after cleaning the dataset, it is analysed to gain insights about the seasonality, trends and noise in the data. This analysis is crucial to create additional features that will help the machine learning models to learn better
3. Feature creation – with the help of the analysis, new additional features are created and are used as “related time series” by AWS forecasting models.
4. Transforming the dataset – Different machine learning models require data to be in different formats such as csv, jsonlines, etc. In this last step, the dataset is transformed and partitioned into training data and testing data and is ready to be fed to different models
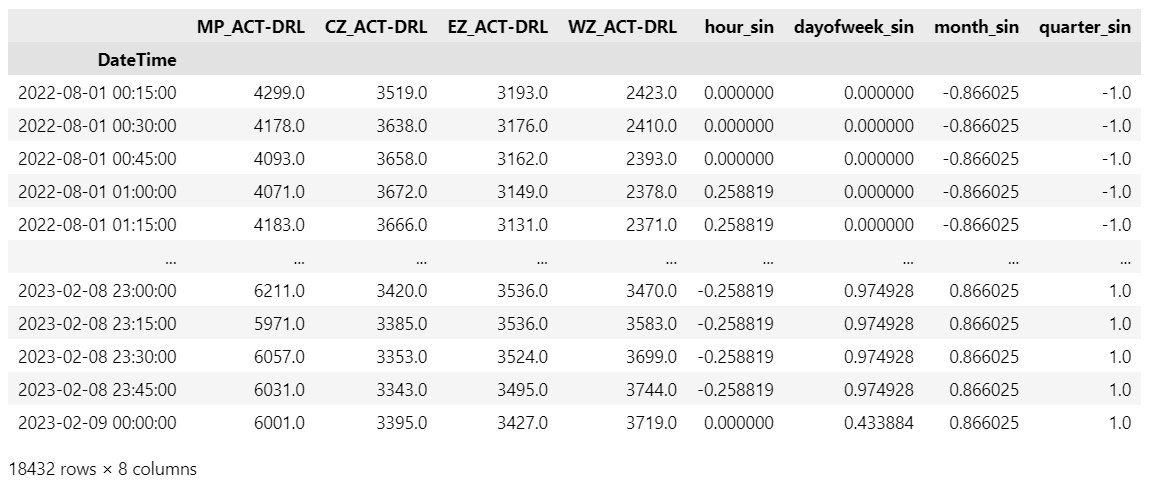
Figure 2 Training Data
We train multiple machine learning models such as Amazon Forecast – AutoML, DeepAR, etc. and test them over a period (rolling window). The performances of these models are compared on multiple parameters such as training time, inferencing time, and the total cost of training. Lastly, as model’s accuracy decreases with time due to change in demand patterns, it is required to train the models on the most recent data points.
An inferencing pipeline is developed for our 1-month trial period. During this 1 month, demand data of previous day was uploaded to s3, it was then processed using the same methodology as above, and then used as “context data” to forecast demand for the next day. As we move forward, the forecasted values are compared with the true values and the results are stored.
With Minfy’s forecasting solution, PTC saw results of 98% accurate (0.02 MAPE) for intraday forecasting and over 90% (0.1 MAPE) for day-ahead forecasting. The training time for the model was reduced from 4 hours to just 40 minutes. The inferencing time was reduced to a few seconds.
Deviation settlement penalty worth INR 1-6 billion* can be saved, as the forecasted values are within the permissible range (5%) from true values. Also, With AWS’s infrastructure, the solution can be deployed within weeks compared to on-prem setup, which would take months.
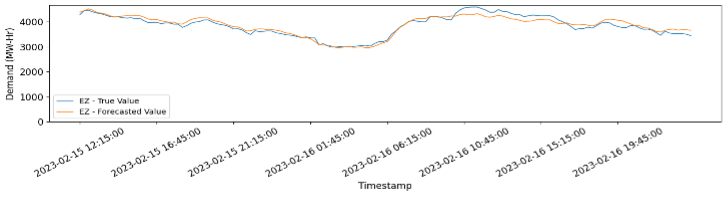

Figure 3 Comparison of True and Forecasted Values for East zone and Central Zone, starting from 15th Feb, 12:15:00 till 18th Feb 00:00
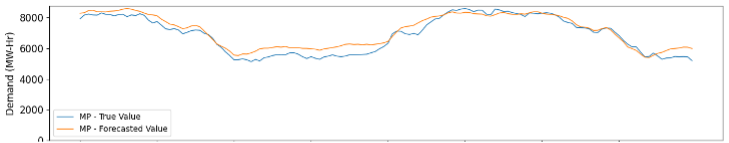
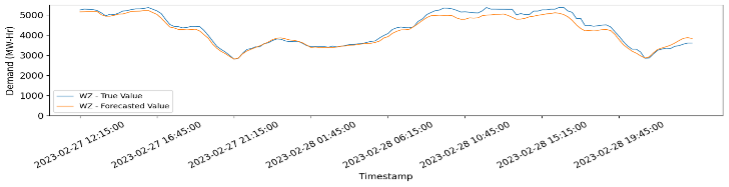
Figure 4 Comparison of True and Forecasted values for West zone and MP, starting from 27th Feb, 12:15:00 till 1st March 00:00.
* Data source – PTC India
PTC is a pioneer in starting a power market in India and undertakes trading activities that include long-term trading of power generated from large power projects, as well as short-term trading arising from supply-and-demand mismatches that inevitably arise in various regions of the country. Since July 2001, when it started trading power on a sustainable basis, PTC has provided optimal value to both buyers and sellers while ensuring optimum usage of resources. PTC has grown from strength to strength, surpassing expectations of growth and has evolved into a Rs.3,496.60 Crore as of March 2020, with a client base that covers all the state utilities of the country, as well as some power utilities in the neighboring countries. https://www.ptcindia.com/
— Author:

Arun Kumar (Head of Technology & Short-Term Power Market, PTC)
Arun Kumar is head of technology and short-term power market at PTC. Arun has over 25 years of experience in the power sector as a corporate leader, equity analyst, and management consultant. Arun previously set up a full-fledged forecasting team, providing demand and renewable-generation forecasting solutions to RLDC, SLDC, DISCOMs, and RE generators. The solution was using a conventional SQL database where the data and weather science team created forecasting algorithms and trained models for generating the outputs. He used the AWS tool for the first time and found the experience very rewarding and cost effective.

Jigar Jain (Project Manager, PTC)
Jigar Jain is project manager at PTC. Jigar is a cloud practitioner and enthusiast. Since 2021, Jigar has been responsible for making major decisions while moving to the cloud and cloud-native architecture at PTC India. Currently, Jigar is actively working on blockchain technologies and sustainability on the cloud.

Rishi Khandelwal (Deeptech Associate Consultant, Minfy)
Rishi Khandelwal is Data scientist at Minfy. He aims to solve challenges in the Energy and Resources Industry. After completing his Masters in AI and Entrepreneurship in 2022, Rishi joined Minfy to help companies leverage the power of data to solve business challenges.
This website stores cookie on your computer. These cookies are used to collect information about how you interact with our website and allow us to remember you. We use this information in order to improve and customize your browsing experience and for analytics and metrics about our visitors both on this website and other media. To find out more about the cookies we use, see our Privacy Policy. If you decline, your information won’t be tracked when you visit this website. A single cookie will be used in your browser to remember your preference not to be tracked.